Factory Automation Mechanical Component Market - Forecast(2021 - 2026)
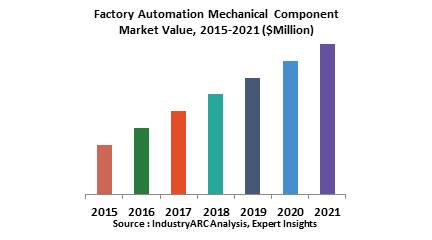
The Global Factory Automation Mechanical Components market is valued at $ 495.3 billion in 2017 and is expected to grow with a CAGR of 5.08% during the forecast period 2017 -2023. Mechanical components are the building blocks of factory automation equipment and processes, many of these components are interdependent and form a solution for any process automation in production, assembly lines, warehousing and others. Some of the key products are Linear Shafts, Shaft Collar, Tubes, Screws, Nuts, Washers, Bushings, Cable Glands, Lens, Bearing Units, General Motors, Valves, Actuators, Adaptors, Solenoid Valves, Cylinders, and many others.

- Innovation & Development: Sensor-enabled rollers and belts which is capable to measure the quantitative metrics of an object, becomes contemporary material in the production planning. This sensor enabled rollers can weigh the products or collects other quantitative measures from the object as the pass on the belts, which in turn helps to minimize the errors and improves the consistency and quality of the output.
- Mergers & Acquisitions: B&R, one of the predominant player in providing product and Technical based solution in industrial automation has been acquired by ABB, the market leader in the factory and industrial automation. This acquisition will provide global opportunities and expertise in large-scale technical and functional knowledge. It is expected that the sales target of B&R would reach more than $1billion in next fiscal year due to ABB’s commitment in B&R’s operational expansion, investment in R&D and other strategies to promote the business model of the company.
- Investments Strategies: Recently, a largest organic investment was made by ABB, an industrial market leader in industrial automation, in Austria. This investment was around 100 million Euro to develop factory automation for future and to create 1000 new jobs. This investment is to build an innovation and training centers by the end of 2020. It is estimated that the company has decided to invest $1.4 billion every year for R&D purposes.
- Evaluate market potential through analyzing growth rates (CAGR %), Volume (Units) and Value ($M) data given at country level – for product types, end use applications and by different industry verticals.
- Understand the different dynamics influencing the market – key driving factors, challenges and hidden opportunities.
- Get in-depth insights on your competitor performance – market shares, strategies, financial benchmarking, product benchmarking, SWOT and more.
- Analyze the sales and distribution channels across key geographies to improve top-line revenues.
- Understand the industry supply chain with a deep-dive on the value augmentation at each step, in order to optimize value and bring efficiencies in your processes.
- Get a quick outlook on the market entropy – M&A’s, deals, partnerships, product launches of all key players for the past 4 years.
- Evaluate the supply-demand gaps, import-export statistics and regulatory landscape for more than top 20 countries globally for the market.
Comments
Post a Comment